● Use Case- AM Part Screening · Technology Selection · Make-or-Buy
● Year 2026
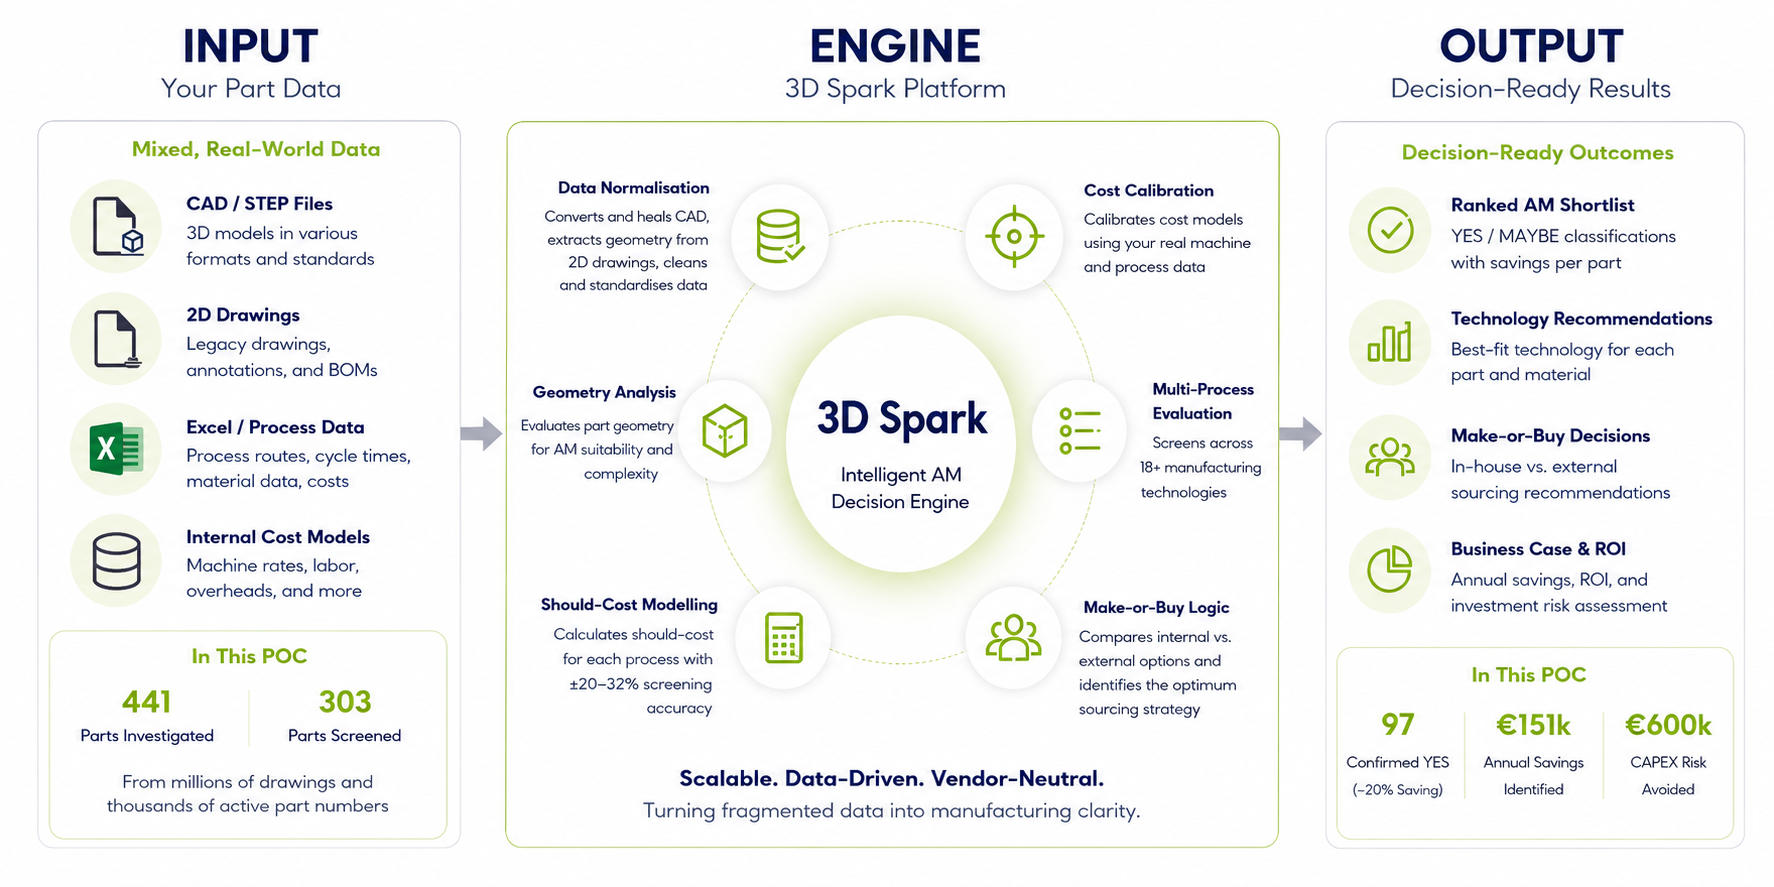
How a global industrial manufacturer used 3D Spark to turn mixed CAD files, 2D drawings, and incomplete process records into a ranked additive manufacturing shortlist.
In one proof of concept, 3D Spark investigated 441 parts, identified 97 confirmed AM candidates, calculated €171k in annual savings, and showed that a €1.2M binder jetting machine investment was not yet justified.
441
PARTS INVESTIGATED
vs. 200 target · 2.2× scope exceeded
17×
ROI IN YEAR 1
on a single POC investment
€600k
INVESTMENT RISK AVOIDED
Risk-adjusted · BJ machine not yet justified
01 · Challenge
A Fragmented Portfolio. No Reliable AM Business Case
A global industrial manufacturer with millions of drawings and thousands of active part numbers had a strong intuition that AM could deliver value — but no systematic way to find out where.
Parts existed in a mix of STEP/CAD files, 2D drawings, and Excel process records of varying completeness. Internal cost models were inconsistent across technologies, making like-for-like comparisons unreliable. The key questions — which parts are AM-suitable, which technology is right, should they make or buy, and is a capital machine investment justified — were unanswerable without a data-driven approach.
"We had the parts, the pressure to reduce costs, and a potential machine investment on the table. What we didn't have was the data to make any of those decisions confidently. 3D Spark gave us that — across hundreds of parts, faster than we could have done it ourselves." Senior Procurement Manager, Global Industrial Manufacturer
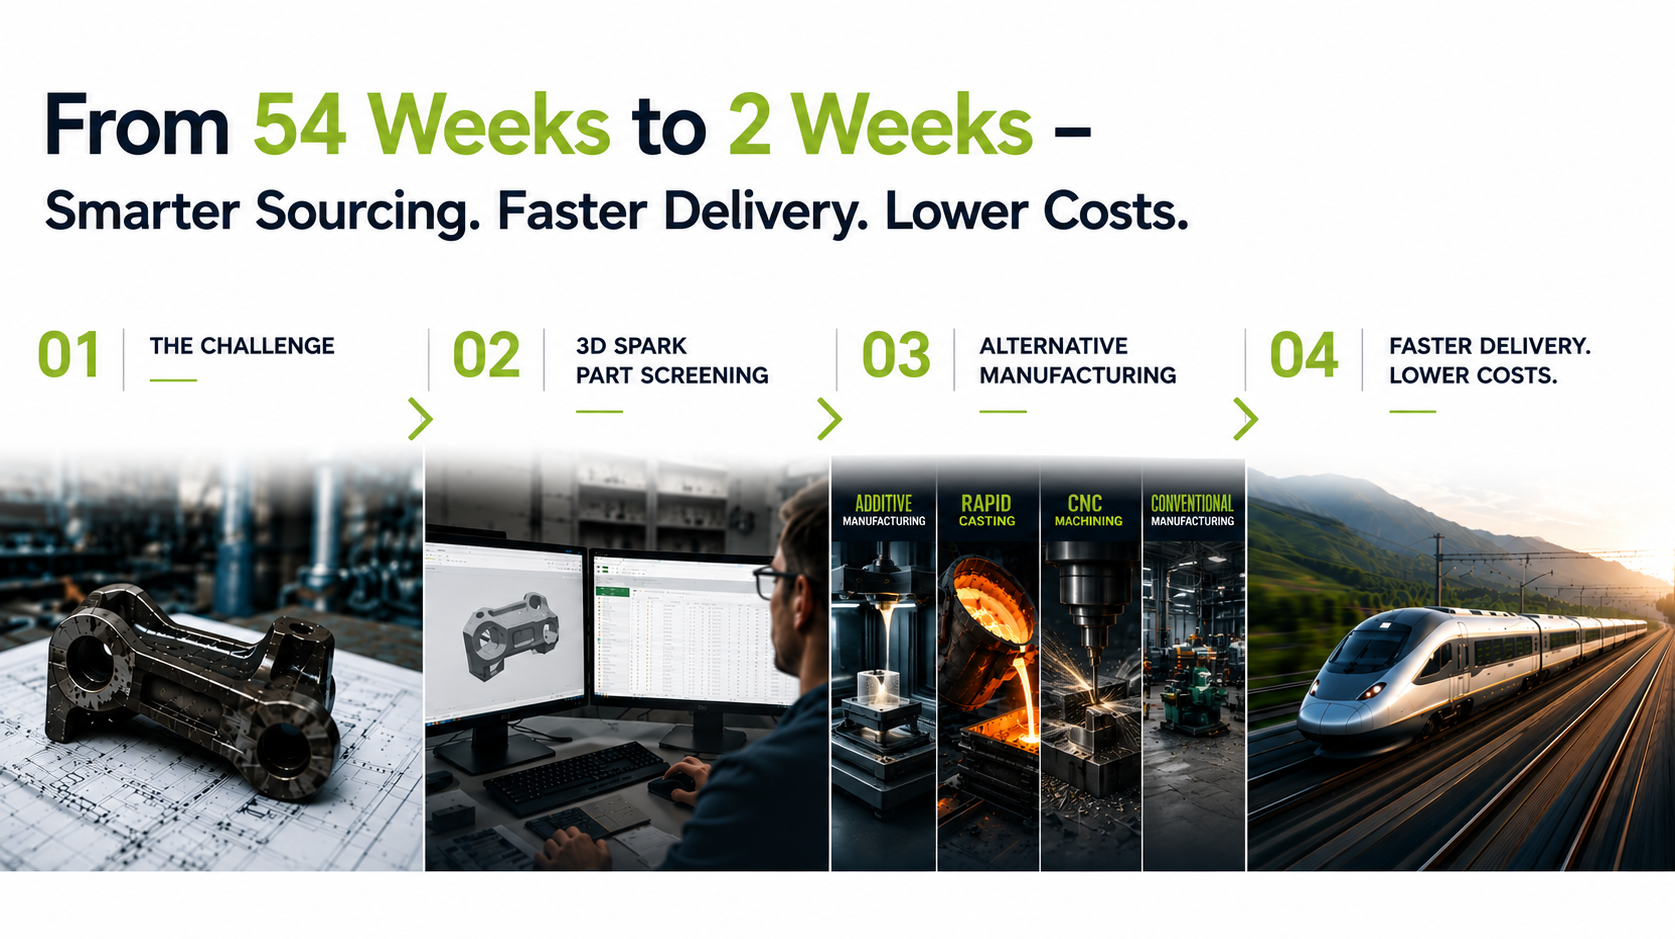
02 · Approach
Real Data In. Ranked Shortlist Out.
3D Spark ingested STEP and CAD models, 2D drawings, and Excel process records, then calibrated cost models against the manufacturer’s real machine data. The portfolio was screened across 18 manufacturing technologies. Each part was evaluated for technical feasibility, geometry-based should-cost, and make-or-buy potential.
Parts with savings clearly above 20% and technical feasibility were classified as confirmed YES candidates. Parts within the ±20% screening precision range were classified as MAYBE candidates for further analysis. Because the goal was portfolio screening rather than final quotation, the analysis used screening-level cost accuracy. Confirmed YES parts were only classified as such when savings remained clearly above the accuracy band.
03 · Part Screening Results
97 Confirmed AM Candidates. €151k/Year Identified.
Out of 441 investigated parts, 303 had sufficient data quality for full screening. From that group, 97 showed clear technical and economic AM potential. That was nearly 10× the original target of 10 business cases. The confirmed AM candidates represented €151,157 in annual savings, with an average saving of €1,558 per SKU.
303
PARTS SCREENED
From 441 investigated · 2.2× original scope
97
CONFIRMED YES
>20% cost saving & technically feasible
52
POTENTIAL MAYBE
Within ±20% precision · further analysis warranted
ANNUAL COST SAVING IDENTIFIED · €151,157/YR TOTAL · €1,558 AVG. PER SKU
Polymer parts
€104,795
Tooling cost
Steel parts
€46,362
Ring parts
04 · Technology Selection
The Right Technology Makes a 6× Difference
Technology selection had more impact than any other variable. For GF polymer tooling, switching from Onyx FDM to Bambu PA6-GF cut costs by 6× overnight.
RECOMMENDED
Bambu PA6-GF (FDM)
€214
~€1,500 machine. Tooling team self-sufficient. Immediate result.
6× MORE EXPENSIVE
FDM (Onyx)
€1,238
Incumbent process. Comparable properties at a fraction of the cost available.
BENCHMARK
Form Milling
€1,834
Conventional baseline.
For steel ring parts, Binder Jetting was recommended for 64% of parts; CNC remained competitive for the remaining 36%. SLM was not cost-competitive at current volumes. Ring geometries are a strong AM fit: high material waste in subtractive manufacturing, long raw material lead times, and downstream grinding cycles all favour BJ.
05 · Make-or-Buy
Two Saving Levers — Technology and Sourcing
Combining the right technology with the right sourcing decision delivered 64% cost reduction. Supplier benchmarking alone — no technology change — yielded a validated 23%.
Across 33 parts with €31,574 investigated volume, optimum sourcing identified €20,162 in annual savings. For polymer tooling, in-house AM beat every external supplier in every case tested. For metal tooling, external sourcing was preferred.
64%
OPTIMUM SOURCING SAVING
Best technology + best supplier · €20,162 identified
23%
SUPPLIER PANEL SAVING
No technology change required · pure renegotiation leverage
06 · Investment Risk
€600k in CAPEX Risk Avoided - Why the €1.2M BJ Investment Was Not Yet Justified
The analysis showed that binder jetting was attractive for selected steel ring parts, but not yet at a scale that justified a production-grade machine investment. A full BJ line would require around €1.2M in capital expenditure. Based on the parts identified in the POC, current utilisation would reach only 21.1%, less than half of the 50% break-even threshold.
The recommendation was clear: buy before you make. Source BJ parts externally now, build quality experience, expand the part portfolio, and revisit the machine investment once utilisation approaches 50% based on real part data. This avoided €600,000 in risk-adjusted CAPEX exposure.
Recommended path: Buy before you Make
Source BJ parts externally now. Build quality experience and expand the part portfolio.
Revisit machine investment when utilisation approaches 50% with real data, not projections.
Risk-adjusted CAPEX exposure avoided: €600,000.
21.1%
CURRENT UTILISATION
From parts identified in this POC
50%
BREAK-EVEN UTILISATION
Required to justify €1.2M CAPEX
07 · Business Case & ROI
€171k Annual Value. 17× Return. Year One.
Three value drivers. One proof of concept. Measurable from day one.
Business case result
Year 1 Value Summary
~17×
ROI in Year 1
Part Screening
97 confirmed parts · €1,558 avg. saving per SKU
€151,157 / yr
Optimum Sourcing
33 parts · 64% cost reduction
€20,162 / yr
Net Annual Value
Validated annual saving potential from the POC
€171,319
Strategic CAPEX Risk Avoided
Risk-adjusted · BJ machine not yet justified
€600,000
The POC covered ~400 parts. Thousands remain unanalysed. At 5,000 parts screened or €200k AM volume, annual savings exceed the 3D Spark licence cost — 3× ROI or more sustained year on year.
Immediate 6× cost reduction on GF polymer tooling. No specialist support needed.
NOW
2
Place first external AM orders on YES parts
Validate quality via the 3D Spark supplier panel before committing to volume.
NOW
3
Licence the platform for ongoing use
At 5,000 parts screened or €200k AM volume, annual savings exceed the licence cost, 3× ROI or more from year one.
SHORT-TERM
4
Scale screening to the full portfolio
Each 1,000 parts screened yields ~20 new AM candidates and ~€31k in additional annual saving.
MID-TERM
5
Revisit Binder Jetting machine investment
Re-evaluate CAPEX when utilisation approaches 50%, backed by real part data, not projections.
LONG-TERM
Key Takeaways
What This POC Proved
Fragmented portfolios become ranked shortlists
Mixed 2D drawings, STEP files, and Excel records — calibrated against real machine data — produced a clean, decision-ready AM pipeline with no manual triage.
Technology selection is the biggest lever
Choosing Bambu PA6-GF over Onyx FDM cut GF tooling costs from €1,238 to €214. BJ dominated steel at 64%; SLM was recommended for zero steel parts at current volumes.
21% utilisation vs. 50% break-even meant the €1.2M BJ machine was not justified. The risk-adjusted €600k avoided is the single most valuable output of the POC.
2D drawings are not a blocker.
Drawing-to-CAD conversion now achieves 90–100% geometric accuracy. Legacy parts without CAD are fully analysable.
Want to find the same hidden AM business cases in your part portfolio?
Start with a data-driven part screening POC and turn CAD files, 2D drawings, and process data into a ranked make-or-buy shortlist.
Interested in hearing more? Book a demo or upload a part!
Upload your part and get started for free
Try our platform for free by uploading your part and receive a free report
With features to make every step of your manufacturing business more efficient and scalable, coupled with a support team excited to help you, getting started with 3D Spark has never been easier.


)%20(1).avif)


.png)
.png)


